Visualizations for mlr3::PredictionClassif.
The argument type controls what kind of plot is drawn.
Possible choices are:
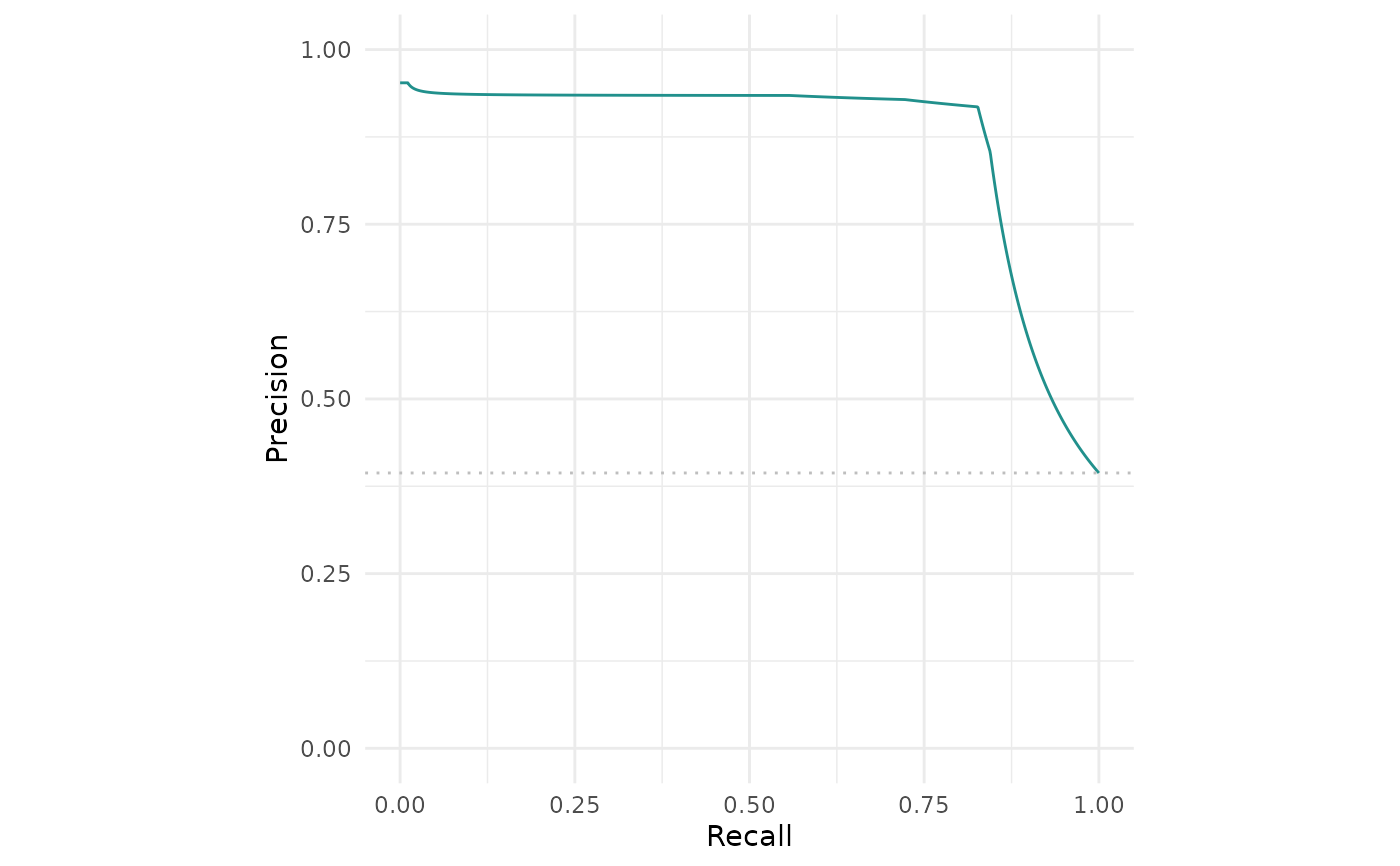
"stacked"(default): Stacked barplot of true and estimated class labels."roc": ROC curve (1 - specificity on x, sensitivity on y). Requires package precrec."prc": Precision recall curve. Requires package precrec."threshold": Systematically varies the threshold of the mlr3::PredictionClassif object and plots the resulting performance as returned bymeasure.
Usage
# S3 method for class 'PredictionClassif'
autoplot(
  object,
  type = "stacked",
  measure = NULL,
  theme = theme_minimal(),
  ...
)
Arguments
- object
- type
(character(1)):
Type of the plot. See description.- measure
(mlr3::Measure)
Performance measure to use.- theme
(
ggplot2::theme())
Theggplot2::theme_minimal()is applied by default to all plots.- ...
(ignored).
References
Saito T, Rehmsmeier M (2017). “Precrec: fast and accurate precision-recall and ROC curve calculations in R.” Bioinformatics, 33(1), 145-147. doi:10.1093/bioinformatics/btw570 .