Plots for Hierarchical Clustering Learners
Source:R/LearnerClustHierarchical.R
autoplot.LearnerClustHierarchical.RdVisualizations for hierarchical clusters.
The argument type controls what kind of plot is drawn.
Possible choices are:
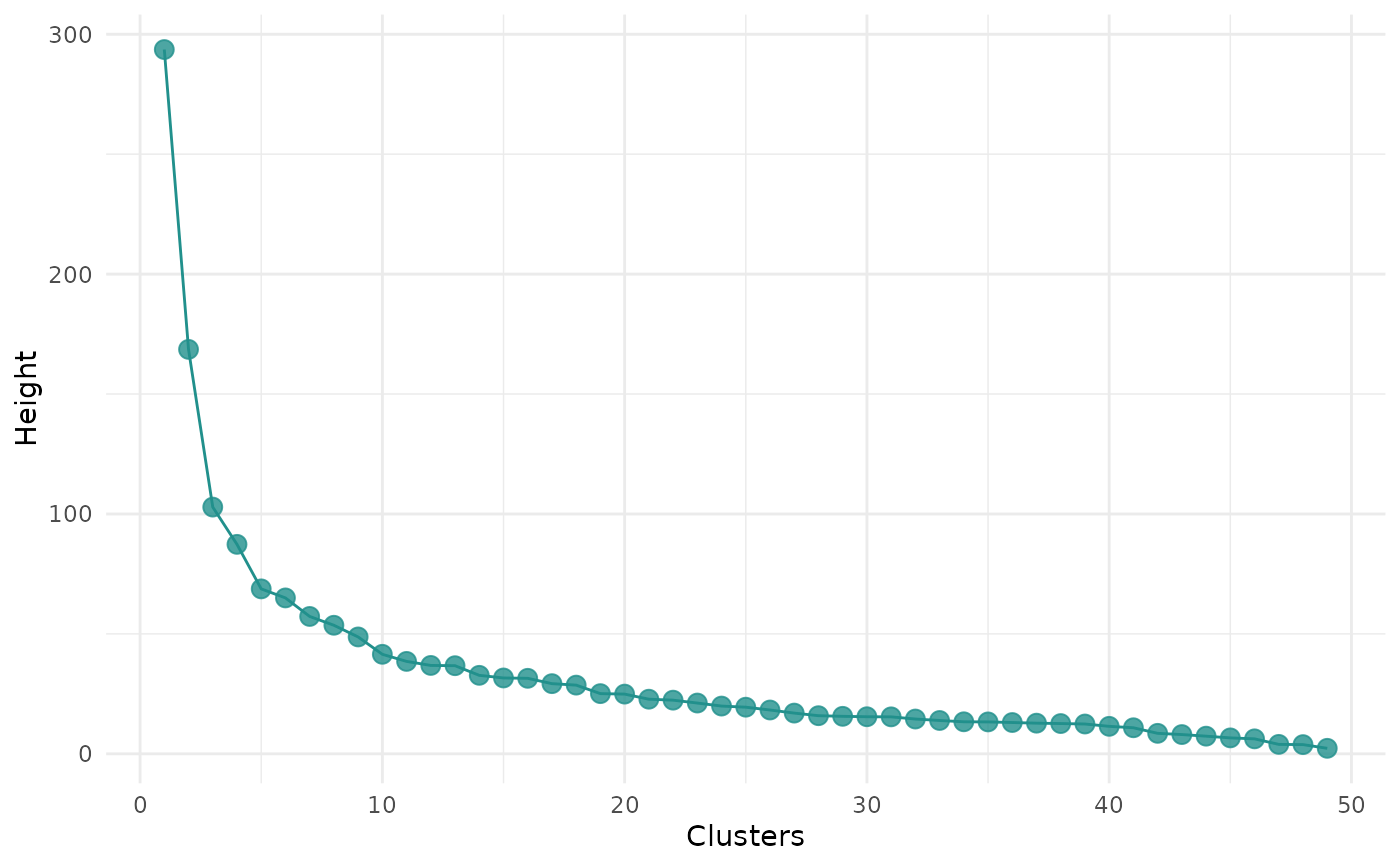
"dend"(default): Dendrograms using ggdendro package."scree": Scree plot that shows the number of possible clusters on the x-axis and the height on the y-axis.
Usage
# S3 method for class 'LearnerClustHierarchical'
autoplot(
  object,
  type = "dend",
  task = NULL,
  theme = theme_minimal(),
  theme_dendro = TRUE,
  ...
)
Arguments
- object
(mlr3cluster::LearnerClustAgnes | mlr3cluster::LearnerClustDiana | mlr3cluster::LearnerClustHclust).
- type
(character(1)):
Type of the plot. See description.- task
(mlr3::Task)
Optionally, pass the task to add labels of observations to ahclustdendrogram. Labels are set via the row names of the task.- theme
(
ggplot2::theme())
Theggplot2::theme_minimal()is applied by default to all plots.- theme_dendro
(
logical(1))
IfTRUE(default), the special dendrogram theme from ggdendro package is used in plot"dend". Set toFALSEto use the theme passed intheme.- ...
(ignored).
Examples
if (mlr3misc::require_namespaces("mlr3cluster", quietly = TRUE)) {
library(mlr3cluster)

task = tsk("usarrests")

# agnes clustering
learner = lrn("clust.agnes")
learner$train(task)
autoplot(learner)

# diana clustering
learner = lrn("clust.diana")
learner$train(task)
autoplot(learner)

# hclust clustering
learner = lrn("clust.hclust")
learner$train(task)
autoplot(learner, type = "scree")
}