Visualizations for mlr3filters::Filter.
The argument type controls what kind of plot is drawn.
Possible choices are:
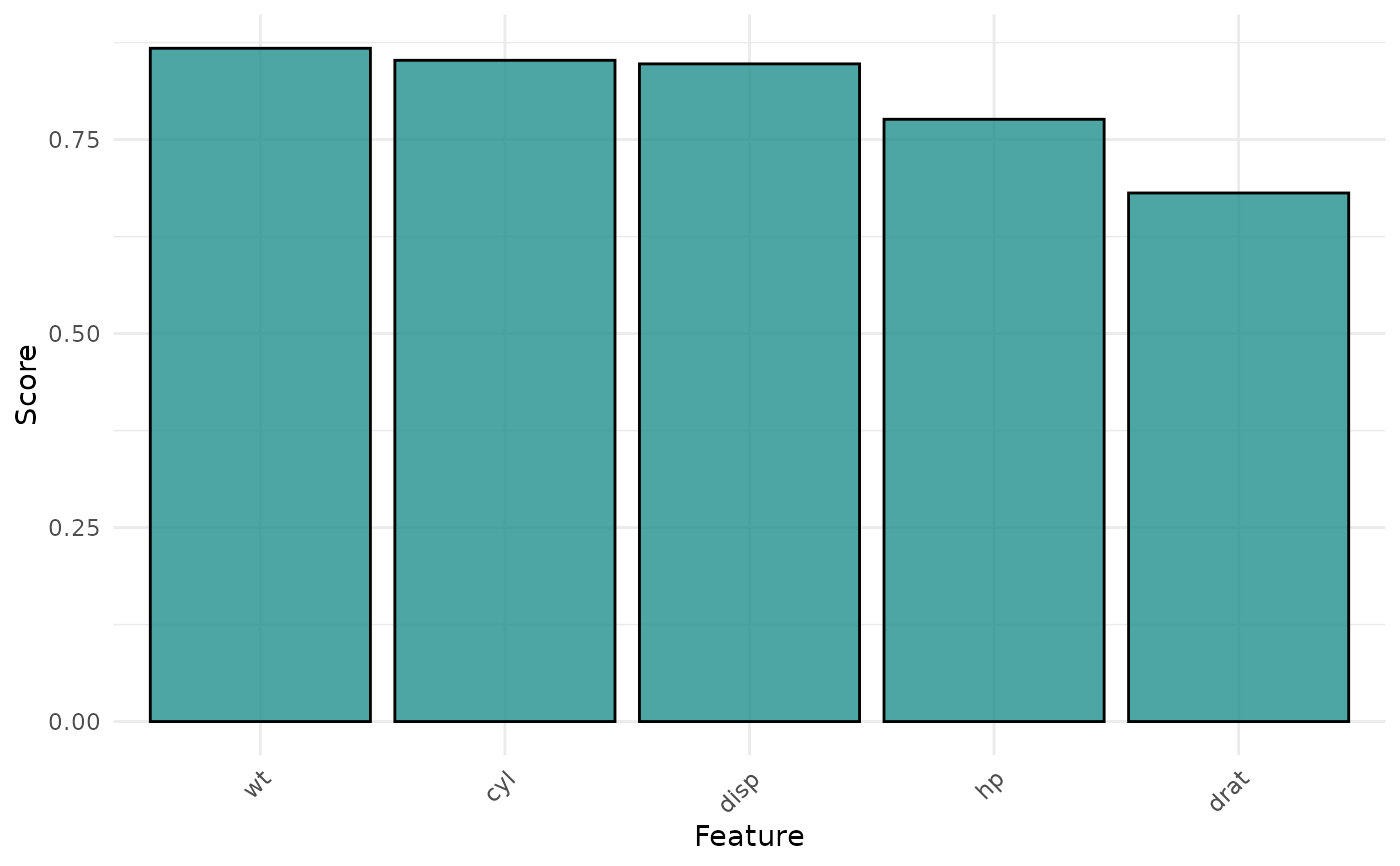
"barplot"(default): Bar plot of filter scores.
Usage
# S3 method for class 'Filter'
autoplot(object, type = "boxplot", n = Inf, theme = theme_minimal(), ...)
Arguments
- object
- type
(character(1)):
Type of the plot. See description.- n
(
integer(1))
Only include the firstnfeatures with the highest importance. Defaults to all features.- theme
(
ggplot2::theme())
Theggplot2::theme_minimal()is applied by default to all plots.- ...
(ignored).
Examples
if (mlr3misc::require_namespaces("mlr3filters", quietly = TRUE)) {
library(mlr3filters)

task = tsk("mtcars")
f = flt("correlation")
f$calculate(task)

head(fortify(f))
autoplot(f, n = 5)
}