Visualizations for mlr3::ResampleResult.
The argument type controls what kind of plot is drawn.
Possible choices are:
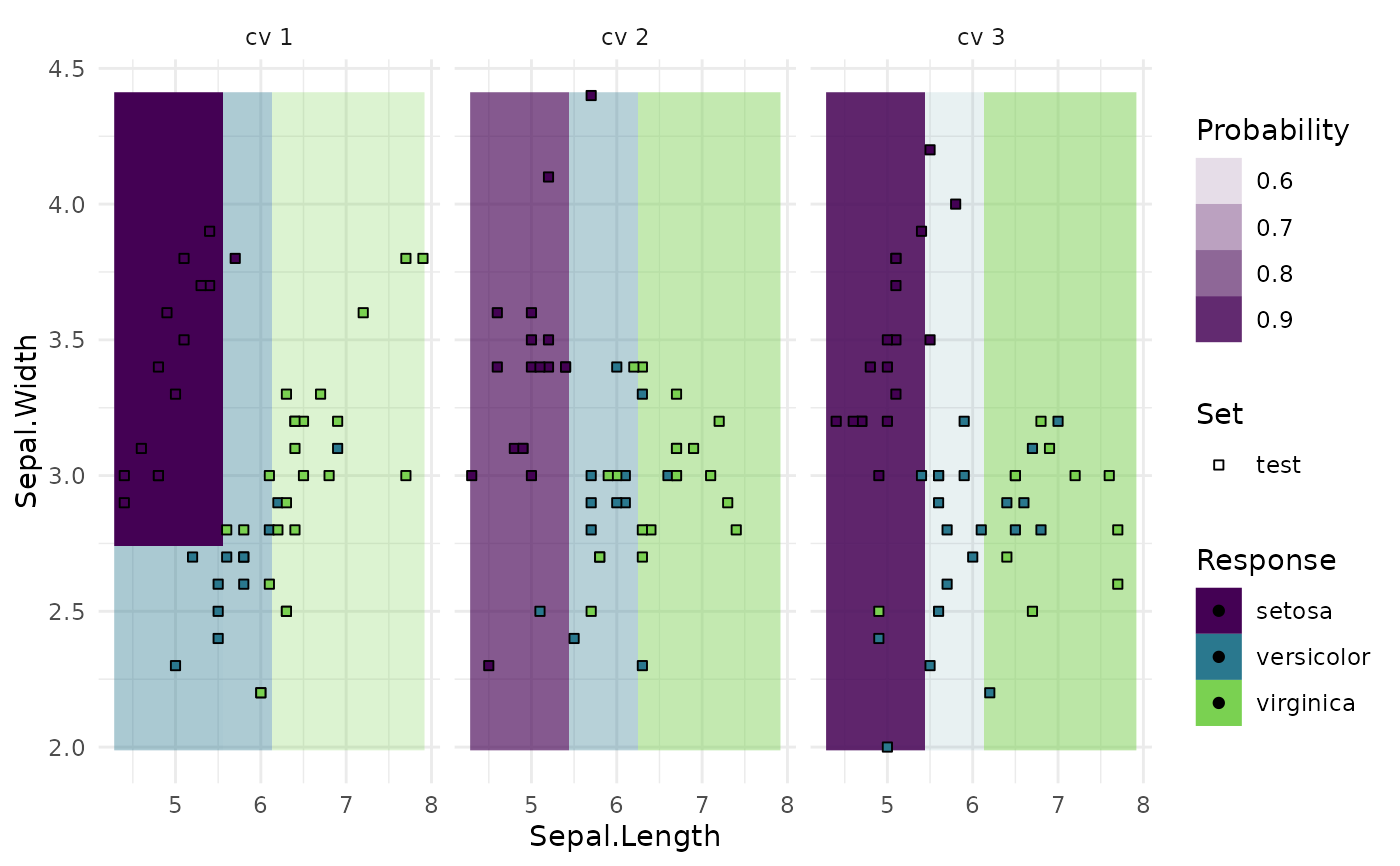
"boxplot"(default): Boxplot of performance measures."histogram": Histogram of performance measures."roc": ROC curve (1 - specificity on x, sensitivity on y). The predictions of the individual mlr3::Resamplings are merged prior to calculating the ROC curve (micro averaged). Requires package precrec."prc": Precision recall curve. See"roc"."prediction": Plots the learner prediction for a grid of points. Needs models to be stored. Setstore_models = TRUEformlr3::resample(). For classification, we support tasks with exactly two features and learners withpredict_type=set to"response"or"prob". For regression, we support tasks with one or two features. For tasks with one feature we can print confidence bounds if the predict type of the learner was set to"se". For tasks with two features the predict type will be ignored.
Usage
# S3 method for class 'ResampleResult'
autoplot(
  object,
  type = "boxplot",
  measure = NULL,
  predict_sets = "test",
  binwidth = NULL,
  theme = theme_minimal(),
  ...
)
Arguments
- object
- type
(character(1)):
Type of the plot. See description.- measure
(mlr3::Measure)
Performance measure to use.- predict_sets
(
character())
Only fortypeset to"prediction". Which points should be shown in the plot? Can be a subset of ("train","test") or empty.- binwidth
(
integer(1))
Width of the bins for the histogram.- theme
(
ggplot2::theme())
Theggplot2::theme_minimal()is applied by default to all plots.- ...
arguments passed on to
precrec::autoplot()fortype = "roc"or"prc". Useful to e.g. remove confidence bands withshow_cb = FALSE.
References
Saito T, Rehmsmeier M (2017). “Precrec: fast and accurate precision-recall and ROC curve calculations in R.” Bioinformatics, 33(1), 145-147. doi:10.1093/bioinformatics/btw570 .
Examples
# \donttest{
if (mlr3misc::require_namespaces("precrec", quietly = TRUE)) {
task = tsk("sonar")
learner = lrn("classif.rpart", predict_type = "prob")
resampling = rsmp("cv", folds = 3)
object = resample(task, learner, resampling)

head(fortify(object))

# Default: boxplot
autoplot(object)

# Histogram
autoplot(object, type = "histogram", bins = 30)

# ROC curve, averaged over resampling folds:
autoplot(object, type = "roc")

# ROC curve of joint prediction object:
autoplot(object$prediction(), type = "roc")

# Precision Recall Curve
autoplot(object, type = "prc")

# Prediction Plot
task = tsk("iris")$select(c("Sepal.Length", "Sepal.Width"))
resampling = rsmp("cv", folds = 3)
object = resample(task, learner, resampling, store_models = TRUE)
autoplot(object, type = "prediction")
}

# }
# }