Plots for Rpart Learners
Source:R/LearnerClassifRpart.R, R/LearnerRegrRpart.R
autoplot.LearnerClassifRpart.RdVisualizations for mlr3::LearnerClassifRpart.
The argument type controls what kind of plot is drawn.
Possible choices are:
"prediction"(default): Decision boundary of the learner and the true class labels."ggparty": Visualizes the tree using the package ggparty.
Usage
# S3 method for class 'LearnerClassifRpart'
autoplot(
  object,
  type = "prediction",
  task = NULL,
  grid_points = 100L,
  expand_range = 0,
  theme = theme_minimal(),
  ...
)

# S3 method for class 'LearnerRegrRpart'
autoplot(
  object,
  type = "prediction",
  task = NULL,
  grid_points = 100L,
  expand_range = 0,
  theme = theme_minimal(),
  ...
)
Arguments
- object
- type
(character(1)):
Type of the plot. See description.- task
(mlr3::Task)
Train task.- grid_points
(integer(1))
Number of grid points per feature dimension.- expand_range
(numeric(1))
Expand the range of the grid.- theme
(
ggplot2::theme())
Theggplot2::theme_minimal()is applied by default to all plots.- ...
(ignored).
Examples
if (mlr3misc::require_namespaces(c("partykit", "ggparty"), quietly = TRUE)) {
# classification
task = tsk("iris")
learner = lrn("classif.rpart", keep_model = TRUE)
learner$train(task)
autoplot(learner, type = "ggparty")
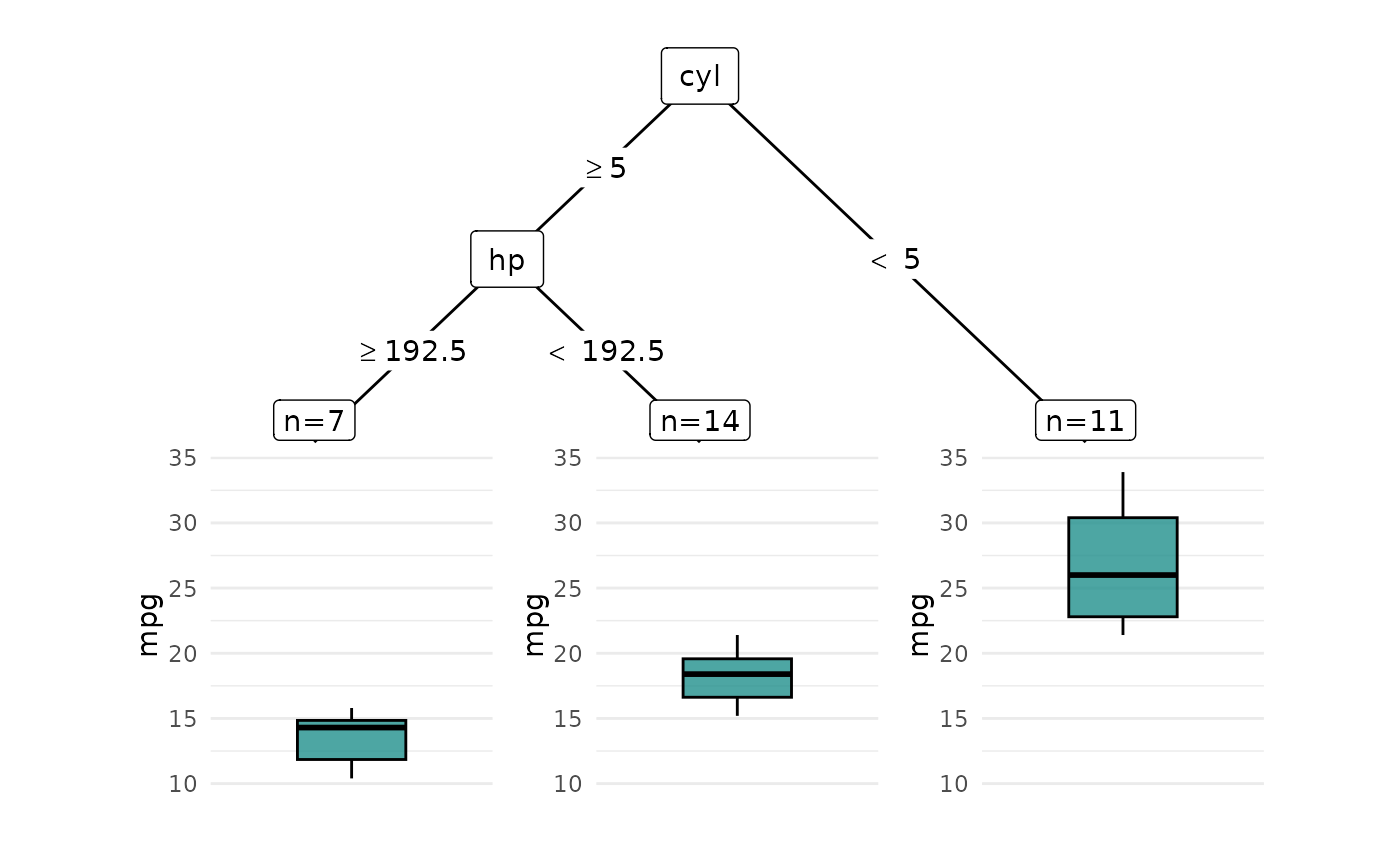
# regression
task = tsk("mtcars")
learner = lrn("regr.rpart", keep_model = TRUE)
learner$train(task)
autoplot(learner, type = "ggparty")
}
#> Warning: Ignoring unknown parameters: `label.size`
#> Warning: Ignoring unknown parameters: `label.size`