Visualizations for mlr3::LearnerClassif.
The argument type controls what kind of plot is drawn.
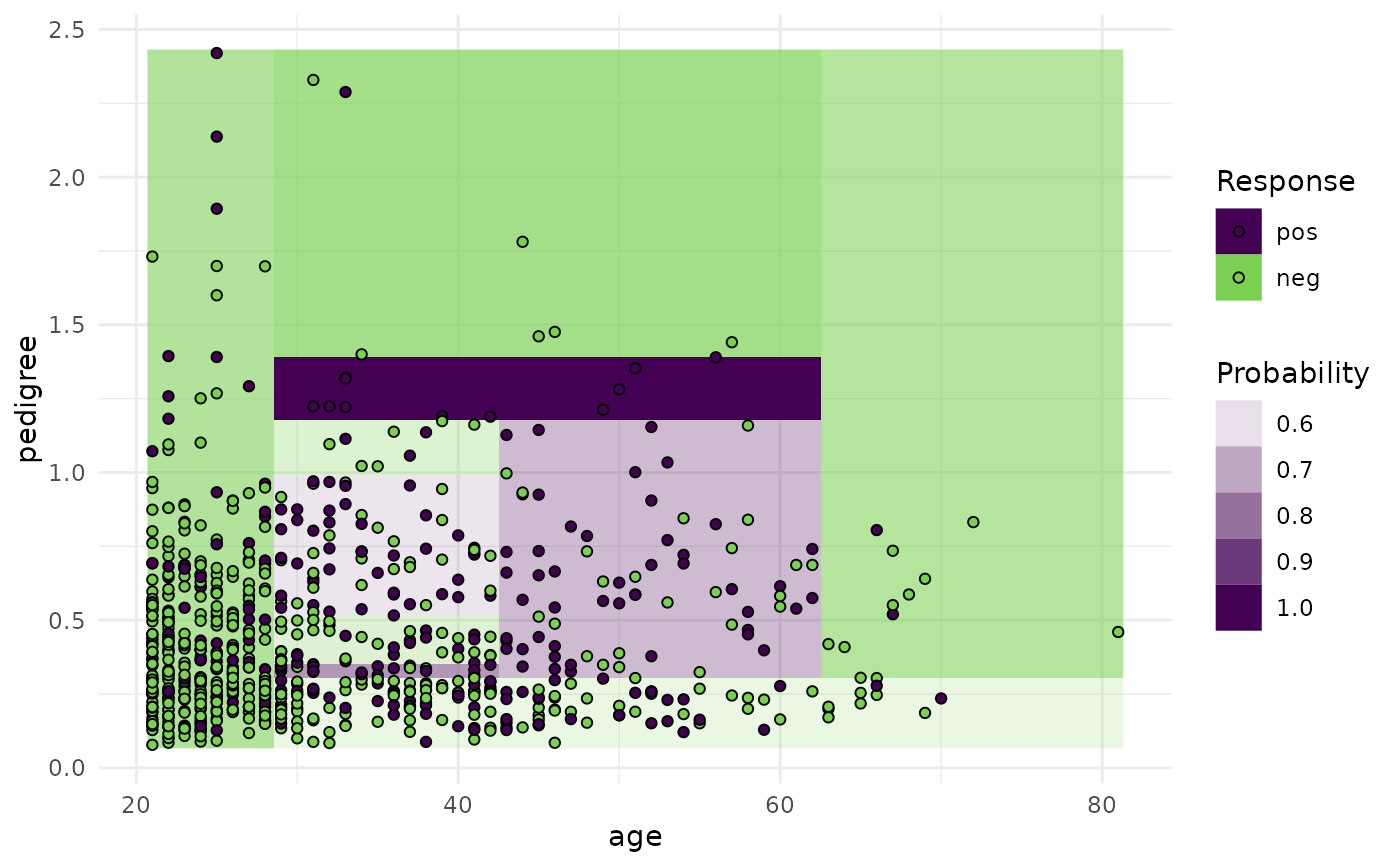
Possible choices are:
"prediction"(default): Decision boundary of the learner and the true class labels.
Usage
# S3 method for class 'LearnerClassif'
autoplot(
  object,
  type = "prediction",
  task,
  grid_points = 100L,
  expand_range = 0,
  theme = theme_minimal(),
  ...
)
Arguments
- object
- type
(character(1)):
Type of the plot. See description.- task
(mlr3::Task)
Train task.- grid_points
(integer(1))
Number of grid points per feature dimension.- expand_range
(numeric(1))
Expand the range of the grid.- theme
(
ggplot2::theme())
Theggplot2::theme_minimal()is applied by default to all plots.- ...
(ignored).