Visualizations for mlr3::BenchmarkResult.
The argument type controls what kind of plot is drawn.
Possible choices are:
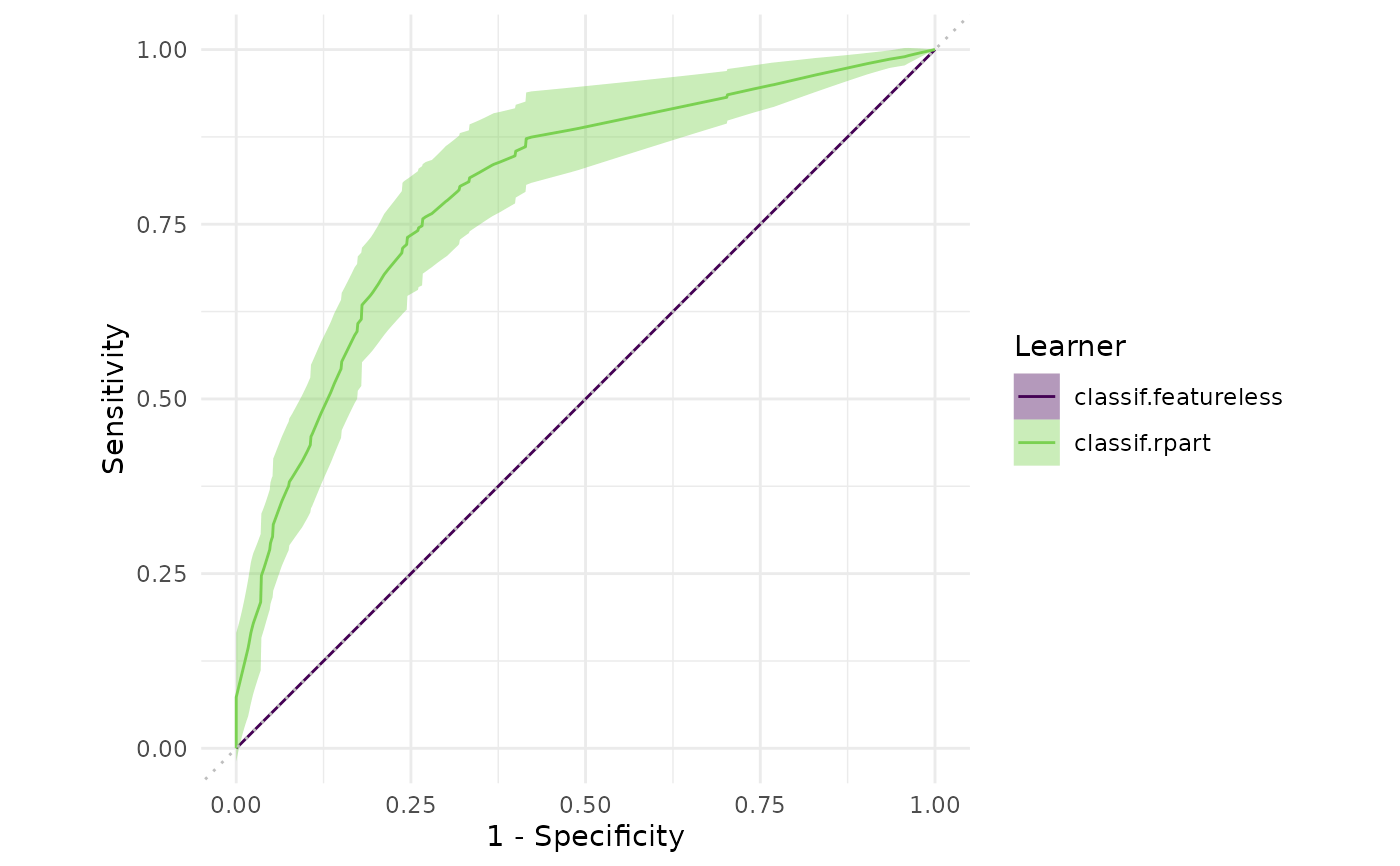
"boxplot"(default): Boxplots of performance measures, one box per mlr3::Learner and one facet per mlr3::Task."roc": ROC curve (1 - specificity on x, sensitivity on y). The mlr3::BenchmarkResult may only have a single mlr3::Task and a single mlr3::Resampling. Note that you can subset any mlr3::BenchmarkResult with its$filter()method (see examples). Requires package precrec."prc": Precision recall curve. See"roc"."ci": Plot confidence intervals. Pass amsr("ci", ...)from themlr3inferrpackage as argumentmeasure.
Usage
# S3 method for class 'BenchmarkResult'
autoplot(
  object,
  type = "boxplot",
  measure = NULL,
  theme = theme_minimal(),
  ...
)
Arguments
- object
- type
(character(1)):
Type of the plot. See description.- measure
(mlr3::Measure)
Performance measure to use.- theme
(
ggplot2::theme())
Theggplot2::theme_minimal()is applied by default to all plots.- ...
arguments passed on to
precrec::autoplot()fortype = "roc"or"prc". Useful to e.g. remove confidence bands withshow_cb = FALSE.
References
Saito T, Rehmsmeier M (2017). “Precrec: fast and accurate precision-recall and ROC curve calculations in R.” Bioinformatics, 33(1), 145-147. doi:10.1093/bioinformatics/btw570 .
Examples
# \donttest{
if (mlr3misc::require_namespaces("precrec", quietly = TRUE)) {
tasks = tsks(c("pima", "sonar"))
learner = lrns(c("classif.featureless", "classif.rpart"), predict_type = "prob")
resampling = rsmps("cv")
object = benchmark(benchmark_grid(tasks, learner, resampling))

head(fortify(object))
autoplot(object)
autoplot(object$clone(deep = TRUE)$filter(task_ids = "pima"), type = "roc")
}

# }
# }